Integrations & Extensions
RHAPSODY telemetry is built on the OpenTelemetry Python SDK and outputs a portable JSONL checkpoint file. This page shows how to connect it to external observability platforms and how to build your own analytics components on top of it.
OTel compatibility
RHAPSODY uses opentelemetry-sdk internally with in-memory providers (no exporter configured by default). You can replace or augment these providers to forward data to any OTel-compatible backend.
What RHAPSODY produces
| Signal | OTel type | Provider |
|---|---|---|
| Task / session traces | Spans (ReadableSpan) |
TracerProvider → SpanBuffer (in-memory) |
| Counters, gauges, histograms | Metrics (MetricsData) |
MeterProvider → InMemoryMetricReader |
| Raw events | JSONL file lines | RHAPSODY checkpoint writer |
Connecting an OTLP exporter (Jaeger, Tempo, Dynatrace…)
RHAPSODY creates its own private TracerProvider and MeterProvider at start_telemetry() time. To forward data to an external backend, pass your pre-built SpanProcessor and/or MetricReader instances — the standard OTel extension points. RHAPSODY wires them into its providers alongside the internal SpanBuffer / InMemoryMetricReader:
from opentelemetry.sdk.trace.export import BatchSpanProcessor
from opentelemetry.exporter.otlp.proto.grpc.trace_exporter import OTLPSpanExporter

telemetry = await session.start_telemetry(
    checkpoint_path="./tel/",
    span_processors=[BatchSpanProcessor(OTLPSpanExporter(endpoint="http://localhost:4317"))],
)
# … run session …
await session.close()   # stops telemetry automatically
All task spans now flow to both Jaeger / Grafana Tempo and the in-memory SpanBuffer (powering read_traces() / task_spans()). RHAPSODY never imports specific exporter classes — you own exporter construction and configuration entirely.
Environment-based configuration
OTel exporters read OTEL_EXPORTER_OTLP_ENDPOINT, OTEL_EXPORTER_OTLP_HEADERS, and
OTEL_SERVICE_NAME from the environment automatically. Pair this with Resource.create()
via the resource parameter:
import os
os.environ["OTEL_SERVICE_NAME"] = "my-app"
os.environ["OTEL_EXPORTER_OTLP_ENDPOINT"] = "https://api.honeycomb.io"
os.environ["OTEL_EXPORTER_OTLP_HEADERS"] = "x-honeycomb-team=YOUR_API_KEY"

from opentelemetry.sdk.trace.export import BatchSpanProcessor
from opentelemetry.exporter.otlp.proto.http.trace_exporter import OTLPSpanExporter

telemetry = await session.start_telemetry(
    span_processors=[BatchSpanProcessor(OTLPSpanExporter())],
)
Grafana + Prometheus (live dashboard)
This setup exports RHAPSODY metrics to Prometheus via the OTel Prometheus exporter, then visualizes them in Grafana.
Step 1 — start Grafana and Prometheus in Docker
# prometheus.yml
cat > prometheus.yml << 'EOF'
global:
  scrape_interval: 5s
scrape_configs:
  - job_name: rhapsody
    static_configs:
      - targets: ['host.docker.internal:9464']
EOF

docker run -d --name prometheus \
  -p 9090:9090 \
  -v $(pwd)/prometheus.yml:/etc/prometheus/prometheus.yml \
  prom/prometheus

docker run -d --name grafana \
  -p 3000:3000 \
  --env GF_AUTH_ANONYMOUS_ENABLED=true \
  --env GF_AUTH_ANONYMOUS_ORG_ROLE=Admin \
  grafana/grafana-oss
Step 2 — install the OTel Prometheus exporter
Step 3 — wire RHAPSODY metrics to the exporter
from opentelemetry.exporter.prometheus import PrometheusMetricReader
from prometheus_client import start_http_server

# Serve Prometheus metrics on port 9464
start_http_server(port=9464)

telemetry = await session.start_telemetry(
    resource_poll_interval=5.0,
    checkpoint_path="./tel/",
    metric_readers=[PrometheusMetricReader()],
)
Step 4 — import the Grafana dashboard
Open http://localhost:3000, add Prometheus (http://localhost:9090) as a data source, and create panels for:
| Panel | PromQL query |
|---|---|
| Tasks running | tasks_running |
| Task throughput | rate(tasks_completed[1m]) |
| Task failure rate | rate(tasks_failed[1m]) |
| CPU utilization | node_cpu_utilization |
| GPU utilization | node_gpu_utilization |
| Memory utilization | node_memory_utilization |
Building a custom analytics component
Any Python object that can receive a BaseEvent can be wired into RHAPSODY as a subscriber. The subscriber runs inside the session process and receives every event in real time.
Example: per-task SLA monitor
from rhapsody.telemetry import TelemetrySubscriber
from rhapsody.telemetry.events import TaskCompleted, TaskFailed

SLA_SECONDS = 30.0

class SLAMonitor:
    def __init__(self, telemetry):
        sub = TelemetrySubscriber(telemetry)
        sub.subscribe(self._on_event)
        self.violations: list[dict] = []

    def _on_event(self, event):
        if isinstance(event, TaskCompleted):
            if event.duration_seconds > SLA_SECONDS:
                self.violations.append({
                    "task_id":  event.task_id,
                    "duration": event.duration_seconds,
                    "backend":  event.backend,
                })
        elif isinstance(event, TaskFailed):
            self.violations.append({
                "task_id":    event.task_id,
                "error_type": event.error_type,
                "backend":    event.backend,
            })

    def report(self):
        print(f"{len(self.violations)} SLA violations detected")
        for v in self.violations:
            print(v)


# Usage
telemetry = await session.start_telemetry()
monitor = SLAMonitor(telemetry)

async with session:
    await session.submit_tasks(tasks)
    await session.wait_tasks(tasks)
# session.close() called by async with — stops telemetry automatically

monitor.report()
Example: GPU overload alerting
from rhapsody.telemetry.events import ResourceUpdate

GPU_ALERT_THRESHOLD = 95.0

def gpu_alert(event):
    if not isinstance(event, ResourceUpdate):
        return
    if event.resource_scope == "per_gpu" and event.gpu_percent is not None:
        if event.gpu_percent >= GPU_ALERT_THRESHOLD:
            print(
                f"[ALERT] GPU {event.gpu_id} on {event.node_id}: "
                f"{event.gpu_percent:.1f}% — threshold {GPU_ALERT_THRESHOLD}%"
            )

telemetry.subscribe(gpu_alert)
Example: custom application event
Use define_event() to add application-domain observability without touching RHAPSODY source. The event flows through the same bus and appears in the JSONL checkpoint alongside system events.
from rhapsody.telemetry import define_event
from rhapsody.telemetry.events import make_event

# Define a typed event class — name must be namespaced (dot required)
DataQualityChecked = define_event(
    "myapp.DataQualityChecked",
    score=float,
    rows_checked=int,
)

# Emit it from application code (after telemetry is started)
telemetry.emit(
    make_event(
        DataQualityChecked,
        session_id=telemetry.session_id,
        backend="app",
        score=0.97,
        rows_checked=50_000,
    )
)

# Receive it in any subscriber
def on_event(event):
    if event.event_type == "myapp.DataQualityChecked":
        if event.score < 0.95:
            print(f"[ALERT] Data quality below threshold: {event.score:.2%}")

telemetry.subscribe(on_event)
Orchestration layers use the same mechanism for layer-specific events. For example, AsyncFlow defines asyncflow.TaskResolved (emitted when all dependencies of a task are satisfied) using define_event rather than adding it to RHAPSODY core:
# Inside AsyncFlow WorkflowEngine.start_telemetry()
TaskResolved = define_event("asyncflow.TaskResolved")
This keeps RHAPSODY's core event schema stable while allowing arbitrary layers to add their own semantics.
Example: forwarding to MLflow
import mlflow
from rhapsody.telemetry.events import SessionEnded

def mlflow_reporter(event):
    if isinstance(event, SessionEnded):
        with mlflow.start_run():
            summary = telemetry.summary()
            mlflow.log_metric("tasks_completed", summary["tasks"]["completed"])
            mlflow.log_metric("tasks_failed",    summary["tasks"]["failed"])
            mlflow.log_metric("session_duration", summary["duration_seconds"])
            if summary["duration"]:
                mlflow.log_metric("mean_task_duration_s", summary["duration"]["mean_seconds"])

telemetry.subscribe(mlflow_reporter)
Replaying a JSONL checkpoint
The JSONL file can be replayed or analyzed offline with any tool that understands newline-delimited JSON.
jq — quick inspection
# Count events by type
jq -r 'select(.section=="event") | .event_type' run.jsonl | sort | uniq -c | sort -rn

# Find slowest tasks
jq 'select(.section=="span" and .name=="task") | {task_id: .attributes.task_id, duration_ms}' \
   run.jsonl | jq -s 'sort_by(.duration_ms) | reverse | .[0:10]'

# Tail resource events live
tail -f run.jsonl | jq 'select(.event_type=="ResourceUpdate") | {resource_scope, node_id, gpu_id, cpu_percent, gpu_percent}'
pandas — time-series analysis
import json
import pandas as pd

records = []
with open("run.jsonl") as f:
    for line in f:
        obj = json.loads(line)
        if obj.get("section") == "event" and obj.get("event_type") == "ResourceUpdate":
            records.append(obj)

df = pd.DataFrame(records)
df["ts"] = pd.to_datetime(df["event_time"], unit="s")
df.set_index("ts", inplace=True)

# Plot CPU per node
df[df["resource_scope"] == "per_node"].groupby("node_id")["cpu_percent"].plot(legend=True)
Trace correlation across components
Every event in the JSONL file carries trace_id and span_id. If an external component (e.g., an ML training framework or workflow orchestrator) is also OTel-instrumented, you can propagate the RHAPSODY session trace_id to create a unified trace across systems.
from opentelemetry import trace

# After telemetry.start() the session span is active
session_ctx = telemetry._session_span.get_span_context()
trace_id = hex(session_ctx.trace_id)

# Pass trace_id to an external component so it can attach its spans
external_component.run(parent_trace_id=trace_id)
In a Grafana Tempo or Jaeger UI you can then search by trace_id and see the session span, all task spans, and any external component spans in a single flame graph.
Session → Task → Resource hierarchy
The OTel parent-child model used by RHAPSODY maps directly onto the trace hierarchy:
Trace (one per session)
└── session span  [SessionStarted … SessionEnded]
    │
    ├── task span  [TaskStarted … TaskCompleted]   task_id=A
    ├── task span  [TaskStarted … TaskFailed]       task_id=B
    ├── task span  [TaskStarted … TaskCompleted]   task_id=C
    │   ⋮
    │
    └── ResourceUpdate events (linked to session span via span_id)
        ├── resource_scope="per_node", node_id=node0, gpu_id=null   (aggregate)
        ├── resource_scope="per_gpu",  node_id=node0, gpu_id=0
        ├── resource_scope="per_gpu",  node_id=node0, gpu_id=1
        └── …
This hierarchy means:
- You can query "all tasks in session X" by filtering on
trace_id. - You can query "all resource metrics during task Y's execution" by joining on
trace_idand the task'sspan_idtime window. - External OTel tools (Jaeger, Tempo) display this as a natural flame graph with session as the root and tasks as child spans.
Real run visualization
The image below is the plot generated from an actual RHAPSODY session using python examples/plot.py. It shows CPU, memory, GPU utilization, disk and network I/O, task throughput, and a task lifetime timeline — all derived from a single JSONL checkpoint file.
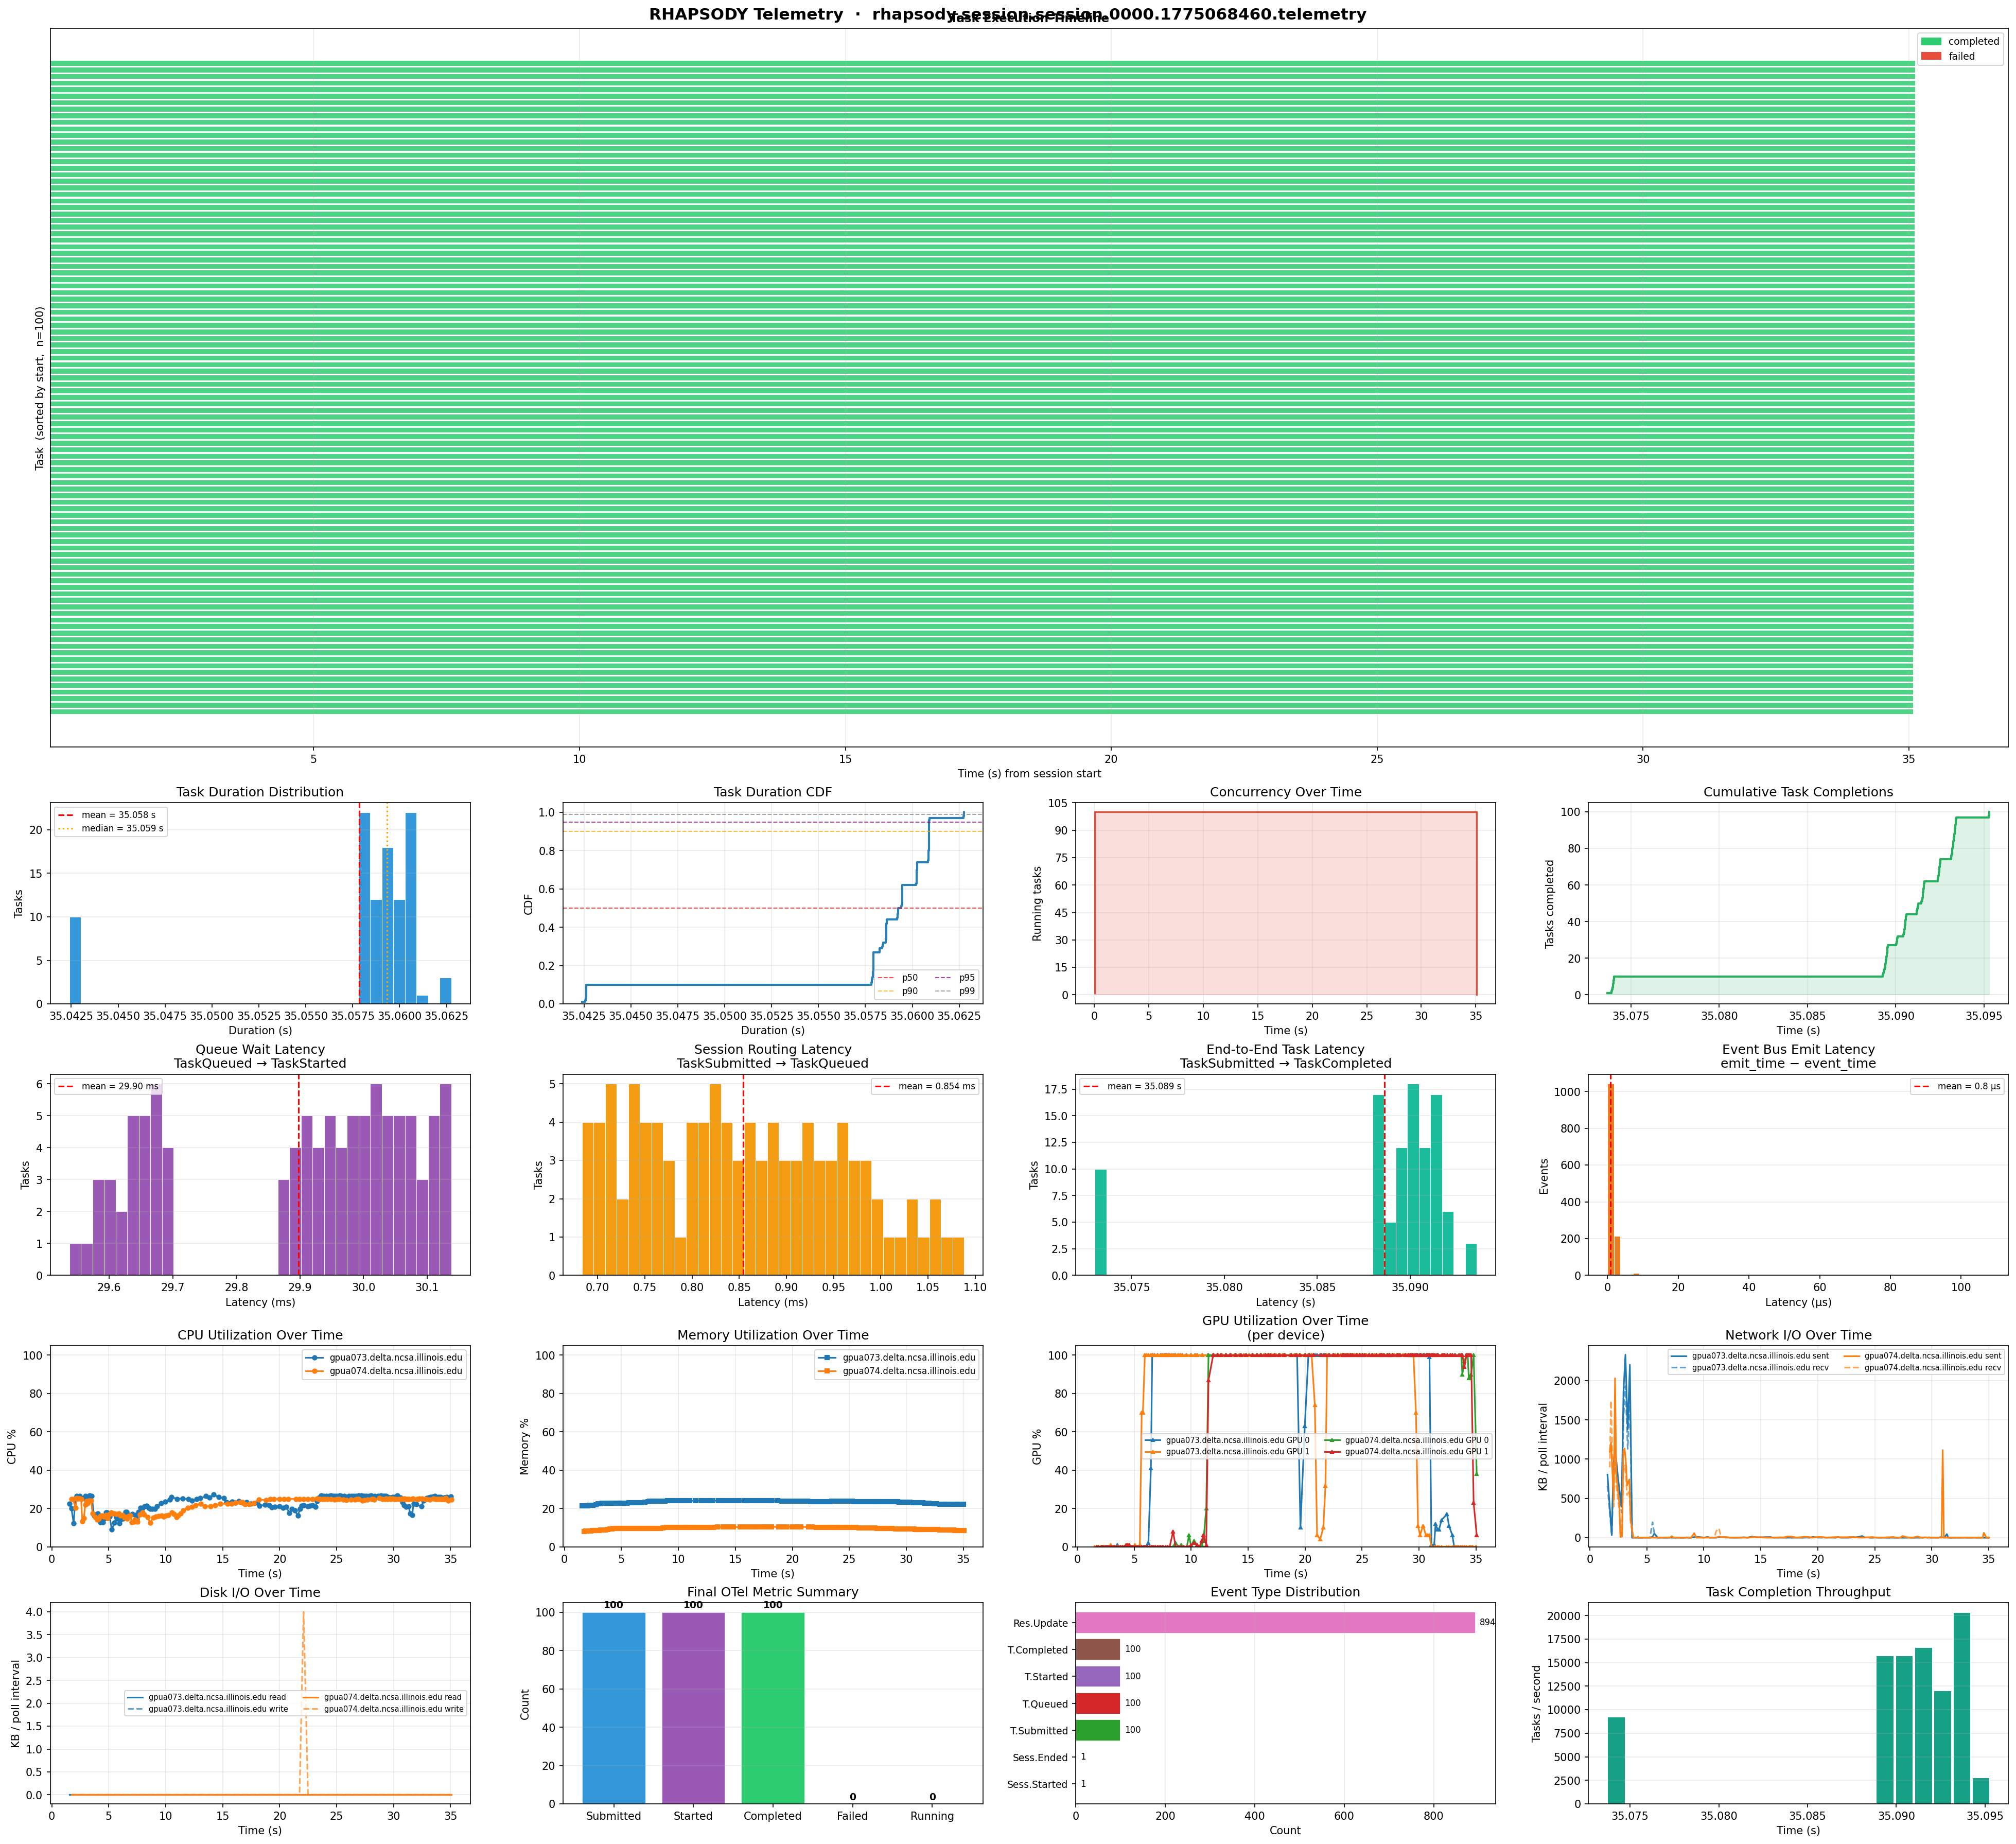
The panels are:
- CPU utilization — per node,
resource_scope="per_node"events only - Memory utilization — per node
- GPU utilization —
resource_scope="per_gpu"events, one line per device; falls back to theper_nodeaggregategpu_percentwhen per-device data is absent - Disk I/O — read and write bytes per interval
- Network I/O — sent and received bytes per interval
- Tasks running — concurrent task count over time
- Task throughput — completions per second in rolling windows
- Task lifetime — horizontal bars showing each task's RUNNING → DONE/FAILED span, colored by status