Telemetry
AsyncFlow exposes the full RHAPSODY Telemetry Abstraction Layer (TAL) through a single call on the WorkflowEngine. This page covers what AsyncFlow adds on top of RHAPSODY's core telemetry and how application-level frameworks can consume the event stream.
For the complete reference on events, OTel instruments, JSONL format, Prometheus/Grafana integration, and custom event creation, see the RHAPSODY Telemetry docs.
Enabling telemetry
Note
Requires: pip install rhapsody-py[telemetry]
from concurrent.futures import ProcessPoolExecutor
from radical.asyncflow import WorkflowEngine
from rhapsody.backends import ConcurrentExecutionBackend

backend = await ConcurrentExecutionBackend(ProcessPoolExecutor())
flow = await WorkflowEngine.create(backend)

telemetry = await flow.start_telemetry(
    resource_poll_interval=5.0,        # node CPU/memory/GPU every 5 s
    checkpoint_path="./telemetry/",    # write a JSONL file (optional)
)
start_telemetry() returns a TelemetryManager. Stop it explicitly when done, or it stops automatically when the workflow engine shuts down:
await flow.shutdown()   # also stops telemetry
# or explicitly:
await telemetry.stop()
Forwarding to an external backend
Pass pre-built OTel SpanProcessor and/or MetricReader instances to forward data to Jaeger, Grafana Tempo, Honeycomb, Prometheus, or any other OTel-compatible backend:
from opentelemetry.sdk.trace.export import BatchSpanProcessor
from opentelemetry.exporter.otlp.proto.http.trace_exporter import OTLPSpanExporter
from opentelemetry.sdk.metrics.export import PeriodicExportingMetricReader
from opentelemetry.exporter.otlp.proto.http.metric_exporter import OTLPMetricExporter

telemetry = await flow.start_telemetry(
    span_processors=[BatchSpanProcessor(OTLPSpanExporter())],
    metric_readers=[PeriodicExportingMetricReader(OTLPMetricExporter())],
)
Exporters read OTEL_EXPORTER_OTLP_ENDPOINT, OTEL_EXPORTER_OTLP_HEADERS, and OTEL_SERVICE_NAME from the environment. See RHAPSODY Integrations for the full parameter reference.
Workflow grouping with workflow_scope()
By default all tasks share the same session_id. Use workflow_scope() to tag every task submitted inside the scope with a asyncflow.workflow_id attribute — enabling per-workflow filtering in Jaeger, Tempo, and the JSONL checkpoint:
async with flow.workflow_scope("etl-run-42"):
    raw = ingest("source.csv")
    val = validate(raw)
    result = await report(val)
Every span and JSONL event emitted inside the scope carries asyncflow.workflow_id = "etl-run-42". The scope maps directly onto a named OTel span (name="workflow"), so the flame graph in Tempo shows session → workflow(etl-run-42) → task hierarchy.
If no workflow_id is passed, one is auto-generated (wf-<hex8>).
# Auto-ID
async with flow.workflow_scope() as wid:
    print(wid)   # e.g. "wf-3a1b9c2d"
@flow.block-decorated functions are automatically tagged with the block's UID as the workflow_id — no explicit workflow_scope() needed inside a block body.
Visualising workflow telemetry
The example in examples/telemetry/01-workflow_grouping.py runs six parallel ML training pipelines (load → preprocess → train → evaluate), each wrapped in a workflow_scope(). Running the companion plotting script against the JSONL checkpoint:
python examples/telemetry/01-workflow_grouping.py --out results/
python examples/telemetry/plot_workflow_gantt.py results/
produces a six-panel dashboard:
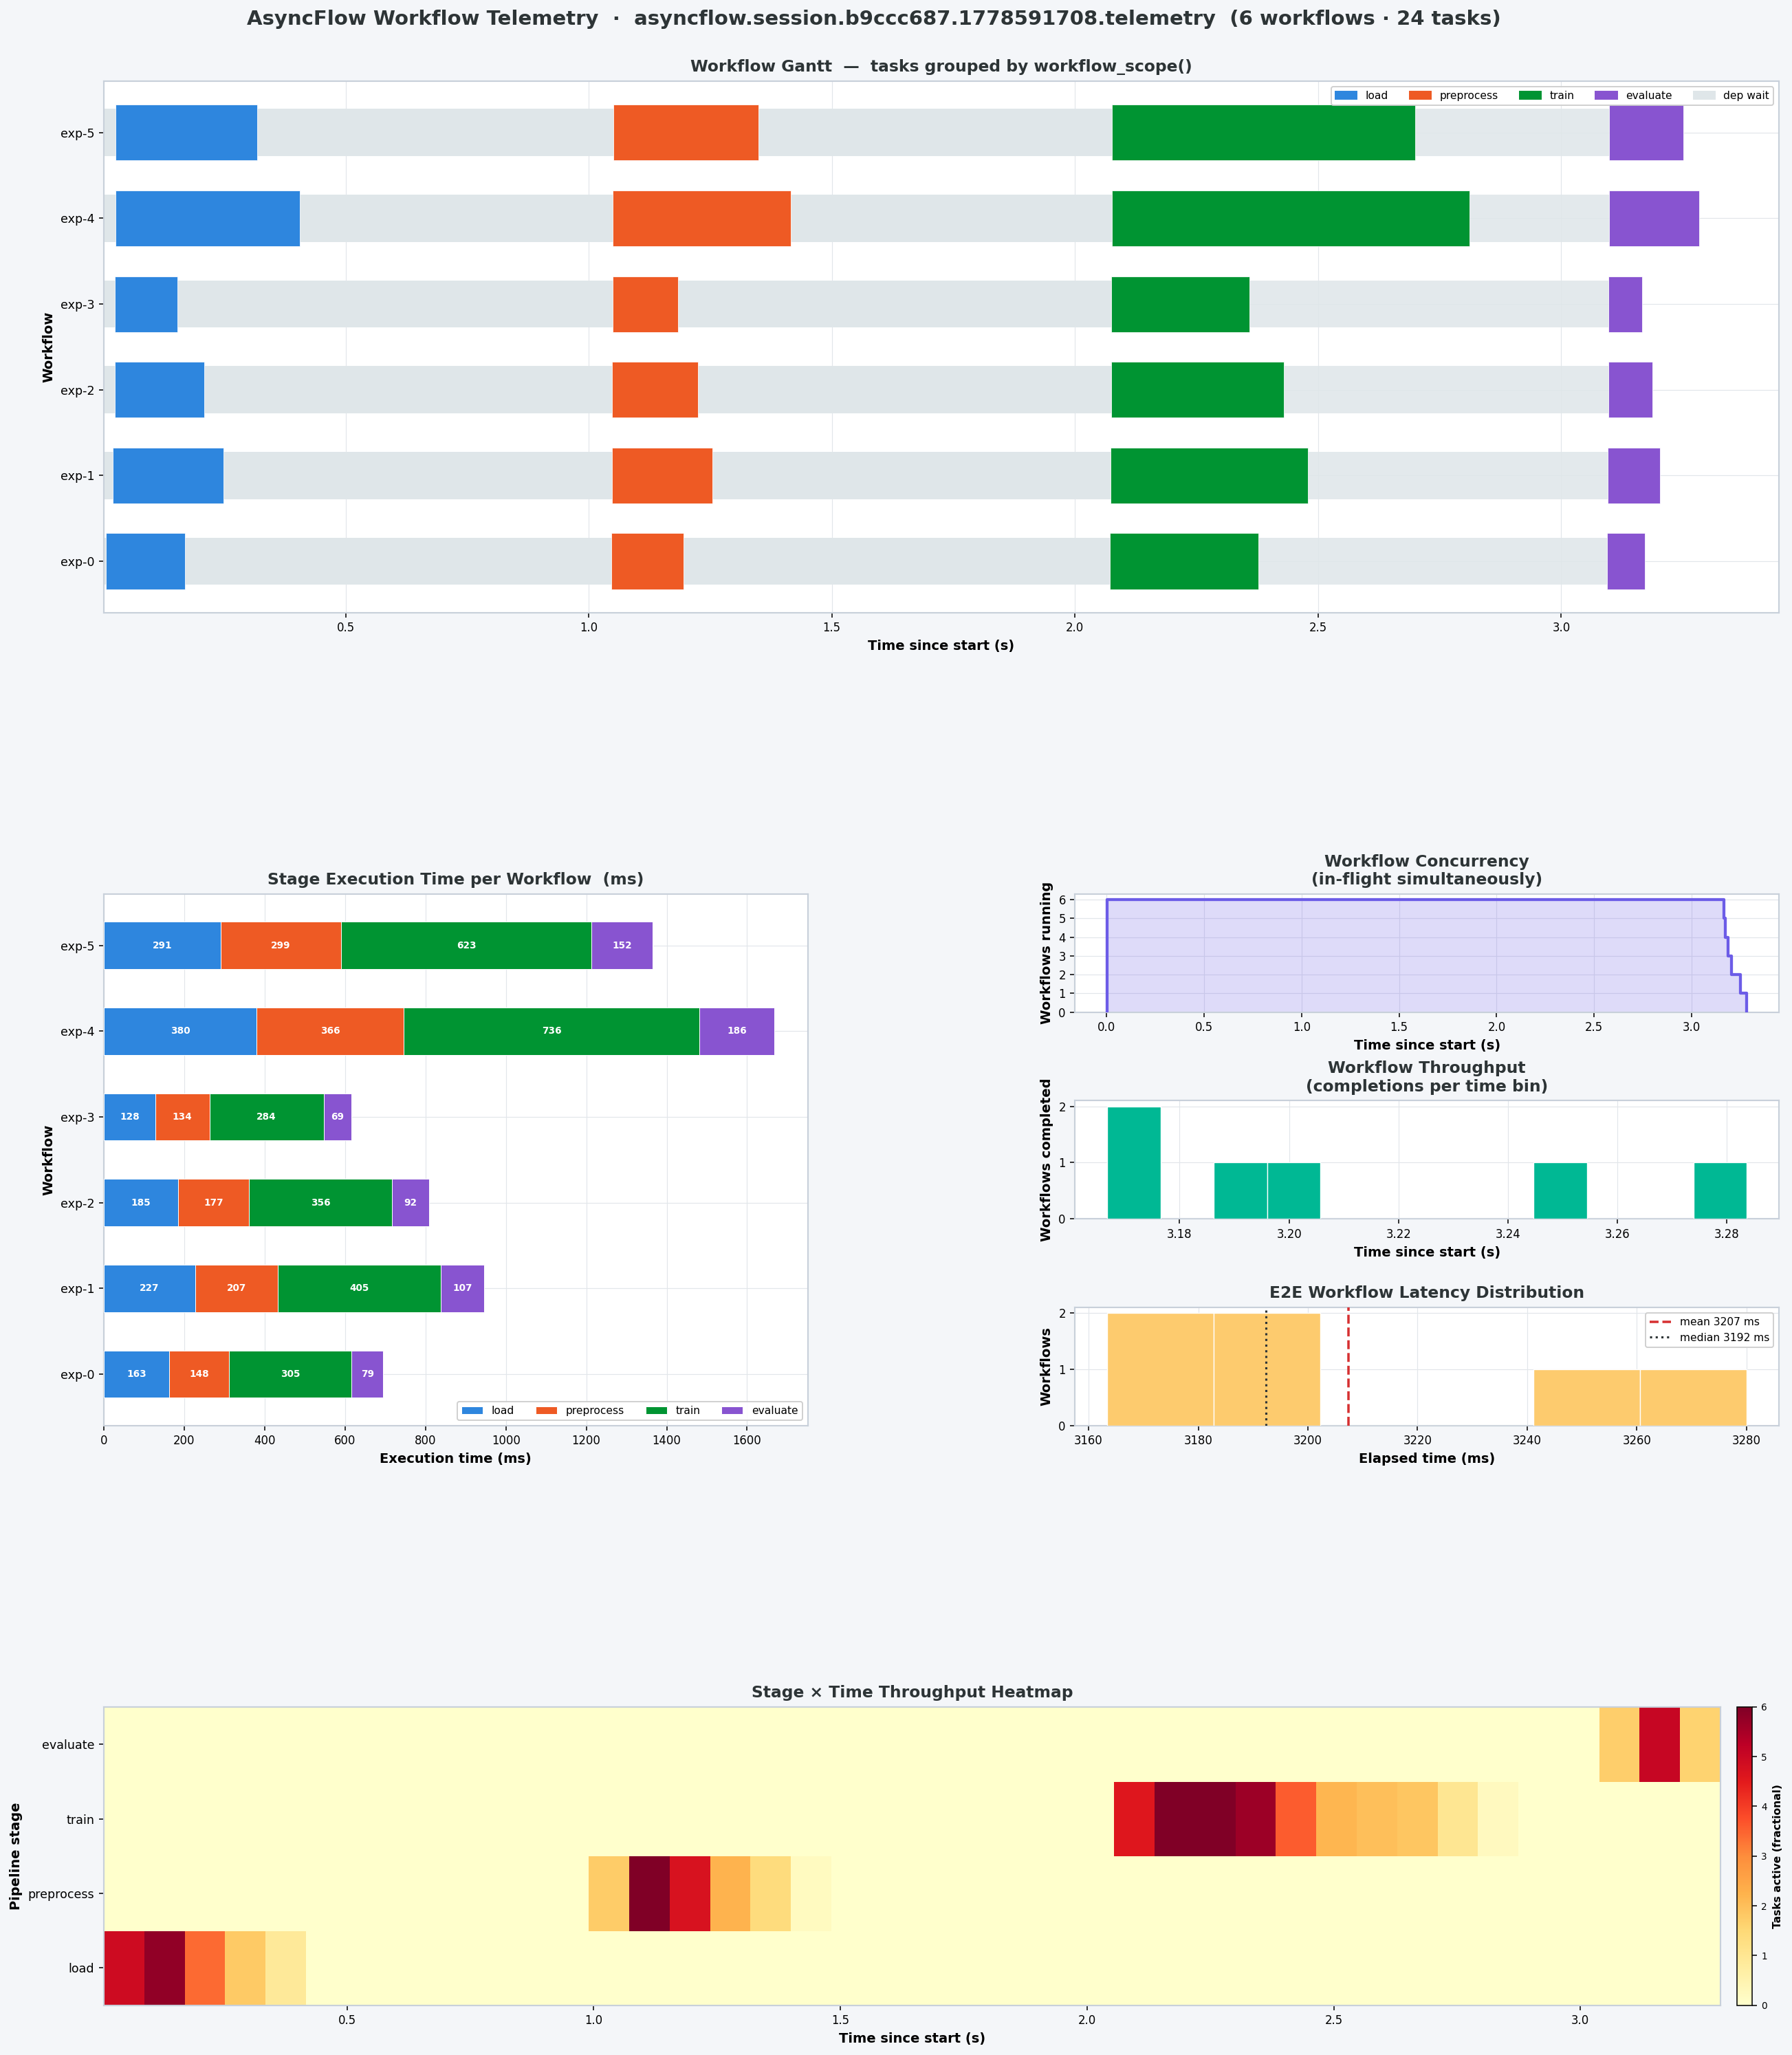
| Panel | What it shows |
|---|---|
| Workflow Gantt | One row per workflow instance; coloured bars = pipeline stages; light band = dependency wait |
| Stage Execution Time | Stacked bars in ms per stage per workflow — reveals which stage dominates each run |
| Workflow Concurrency | In-flight workflows over time — shows scheduler saturation |
| Workflow Throughput | Completion histogram — when pipelines finish relative to session start |
| E2E Latency Distribution | Histogram of total elapsed time per workflow with mean/median lines |
| Stage × Time Heatmap | 2-D heatmap (stages × time bins): task occupancy per cell — reveals bottleneck stages |
OTel span hierarchy
When telemetry is enabled, AsyncFlow produces a four-level span tree:
Trace (one per session)
└── session span  [SessionStarted … SessionEnded]
    │
    ├── workflow span  [workflow_scope("etl-run-42")]
    │   ├── task span  task_id=ingest-001
    │   ├── task span  task_id=validate-001
    │   └── task span  task_id=report-001
    │
    ├── block span  [execute_block("pipeline_block")]
    │   ├── task span  task_id=preprocess-001
    │   ├── task span  task_id=compute-001
    │   └── task span  task_id=store-001
    │
    └── task span  (ungrouped — submitted outside any scope)
The asyncflow.workflow_id attribute is stamped on every task span and every JSONL lifecycle event inside a scope. This makes per-workflow Gantt views, performance comparison across workflow types, and span filtering all possible without any post-processing join.
AsyncFlow-specific events
AsyncFlow emits one event that RHAPSODY core does not:
asyncflow.TaskResolved
Emitted when all upstream dependencies of a task are satisfied — the moment the task becomes eligible for submission. Tasks with dependencies emit it when the last upstream TaskCompleted fires.
asyncflow.TaskResolved is defined using define_event() rather than being hard-coded in RHAPSODY, keeping the core event schema stable:
# event_type = "asyncflow.TaskResolved"
# task_id    = "task.0003"
The asyncflow.TaskResolved is the dependency wait time — how long a task sat in the graph waiting for its inputs.
Full lifecycle from the AsyncFlow perspective
-------------------------- User App Layer ---------------------------
CustomEvent1 (User app)
....
CustomEventN (User app)
-------------------------- AsyncFlow Layer --------------------------

TaskCreated              ← task registered in DAG (AsyncFlow)
    ↓
asyncflow.TaskResolved   ← all upstream deps satisfied (AsyncFlow)
    ↓
TaskSubmitted            ← handed to RHAPSODY session (AsyncFlow)
    ↓

-------------------------- RHAPSODY Layer --------------------------

(TaskQueued)             ← optional, backend-specific (RHAPSODY Backend)
    ↓
TaskStarted              ← worker begins execution (RHAPSODY Backend)
    ↓
TaskCompleted | TaskFailed | TaskCanceled (RHAPSODY Backend)
Subscribing to events
Use telemetry.subscribe() to receive every event in real time. The callback can be sync or async and runs on the asyncio event loop.
def on_event(event):
    print(event.event_type, event.task_id)

telemetry.subscribe(on_event)
Filter by event type:
def on_event(event):
    if event.event_type == "TaskCompleted":
        print(f"done: {event.task_id}  {event.duration_seconds*1000:.0f} ms")
    elif event.event_type == "asyncflow.TaskResolved":
        print(f"resolved: {event.task_id}")
    elif event.event_type == "ResourceUpdate" and event.resource_scope == "per_node":
        print(f"cpu: {event.cpu_percent:.1f}%  mem: {event.memory_percent:.1f}%")
Measure dependency wait time:
resolved_at = {}

def on_event(event):
    if event.event_type == "asyncflow.TaskResolved":
        resolved_at[event.task_id] = event.event_time
    elif event.event_type == "TaskStarted":
        dep_wait_ms = (event.event_time - resolved_at.get(event.task_id, event.event_time)) * 1000
        print(f"{event.task_id}: dep_wait={dep_wait_ms:.0f} ms")
Reading results after the run
await flow.shutdown()

summary = telemetry.summary()
print(summary["tasks"])
# {'submitted': 200, 'completed': 197, 'failed': 2, 'canceled': 1, 'running': 0}

if summary["duration"]:
    print(f"mean task time: {summary['duration']['mean_seconds']*1000:.1f} ms")
Application-level frameworks
If you are building a framework on top of AsyncFlow (e.g. a domain-specific orchestrator, an ML pipeline library, a data processing layer), the telemetry bus is the right place to attach application-domain observability — without leaking implementation details back into AsyncFlow or RHAPSODY.
Defining application events
Use define_event() to create typed event classes. Names must be namespaced (contain a dot). Base fields (event_id, session_id, event_time, etc.) are protected.
from rhapsody.telemetry import define_event
from rhapsody.telemetry.events import make_event

# Define at module level
DataQualityChecked = define_event(
    "myframework.DataQualityChecked",
    dataset=str,
    score=float,
    rows_checked=int,
)

ModelCheckpoint = define_event(
    "myframework.ModelCheckpoint",
    step=(int, -1),
    loss=(float, float("inf")),
    metric=str,
)
Emitting application events
Emit from your framework code (not from inside task functions — see why):
# After a task result is available
result = await my_pipeline_task()

telemetry.emit(
    make_event(
        DataQualityChecked,
        session_id=telemetry.session_id,
        backend="myframework",
        dataset="train_2024",
        score=result["quality_score"],
        rows_checked=result["row_count"],
    )
)
telemetry.emit() is synchronous — no await.
Subscribing in a framework layer
class PipelineMonitor:
    def __init__(self, telemetry):
        self.violations = []
        self.checkpoints = []
        telemetry.subscribe(self._on_event)

    def _on_event(self, event):
        et = event.event_type

        if et == "TaskFailed":
            self.violations.append({
                "task_id": event.task_id,
                "error": event.error_type,
            })
        elif et == "TaskCanceled":
            # Cancellation is intentional — track separately from failures
            pass
        elif et == "myframework.DataQualityChecked":
            if event.score < 0.95:
                print(f"[ALERT] quality {event.score:.2%} on {event.dataset}")
        elif et == "myframework.ModelCheckpoint":
            self.checkpoints.append({"step": event.step, "loss": event.loss})

monitor = PipelineMonitor(telemetry)
Emitting from inside tasks
Do not call telemetry.emit() inside a task function. Task functions are serialized by cloudpickle for subprocess execution. Capturing telemetry in the closure serializes its asyncio state, which fails at runtime.
# ✗ WRONG — telemetry captured in closure, fails with cloudpickle
@flow.function_task
async def bad_task(data):
    result = process(data)
    telemetry.emit(...)   # ← do not do this
    return result

# ✓ CORRECT — emit after awaiting the task future, in the orchestration layer
async def run():
    result_fut = my_task(data)
    result = await result_fut
    telemetry.emit(make_event(MyEvent, ..., value=result["score"]))
Further reading
- RHAPSODY Telemetry Quick Start — enabling telemetry, reading metrics and spans
- Events & Metrics Reference — all event fields, OTel instruments, JSONL format
- Integrations & Extensions — Prometheus, Grafana, Jaeger, MLflow, pandas